Wire Media logo
  • Expertise
    • Custom Web Design
    • Annual/Impact Reports
    • Monthly Care Packages
    • Website Accessibility
  • Work
  • About
  • Learning
    • In-Depth Content
    • Signup for Updates
  • Let’s Chat

Learning

Page 7

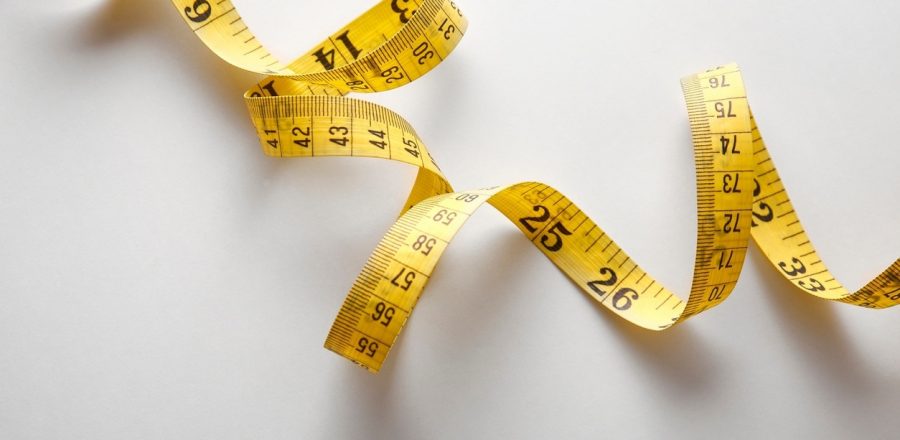
  • ruler - measuring key performance indicators

    Key Performance Indicators (KPIs) for Nonprofit Websites

    November 13, 2018

    data ux design web design
  • How to optimize a nonprofit website - image of a fish jumping frmo a small bowl into a bigger, better bowl

    How to Optimize a Nonprofit Website

    October 30, 2018

    data web design
  • user experience design for nonprofit - image representing artificial intelligence - human head represented with points of light

    User Experience Design for Nonprofits

    October 23, 2018

    data ux design web design
  • How to use data visualization - image of a pencil powered by information icons

    How to Use Data Visualization to Tell a Story

    October 16, 2018

    data visual storytelling
  • measure to improve nonprofit marketing

    Improve Nonprofit Marketing with the Right Numbers

    October 9, 2018

    data resources
  • cheesy stock photos - literally

    Cheesy Stock Photos – Just Stop!

    October 2, 2018

    visual storytelling
  • Person in a red shirt, sitting at a desk looking at graphs and charts. Image is on blue background.

    Nonprofit Website Metrics to Track for Success

    September 25, 2018

    data web design
  • Eisenhower square

    Better Time Management with the Eisenhower Square

    September 21, 2018

    DIY trends
  • data culture - image of bar chart to illustrate concept of data

    Data Culture in Nonprofits: How to Get it

    September 8, 2018

    data impact and annual report visual storytelling
  • emoticons with different reactions to storytelling

    Storytelling to Jumpstart Your Next Fundraiser

    August 27, 2018

    content strategy impact and annual report visual storytelling
  • nonprofit websites - superhero

    Nonprofit Websites: 7 Tips to be a Superhero

    August 16, 2018

    visual storytelling web design
  • outputs versus outcomes - true north

    Outputs versus Outcomes? Find Your True North.

    August 9, 2018

    data impact and annual report
Previous 1 … 5 6 7 8 9 … 11 Next
Wire Media logo

We’re a user experience design agency with expertise in visual storytelling and website accessibility. We work with nonprofits, universities, and social impact companies.

  • Accessibility
  • Privacy Policy
  • Careers
Certified B Corporation

Get updates

"*" indicates required fields

This field is for validation purposes and should be left unchanged.
Facebook LinkedIn Twitter

©2023 Wire Media